Lars Grammel
Canadian Population Pyramids
2012
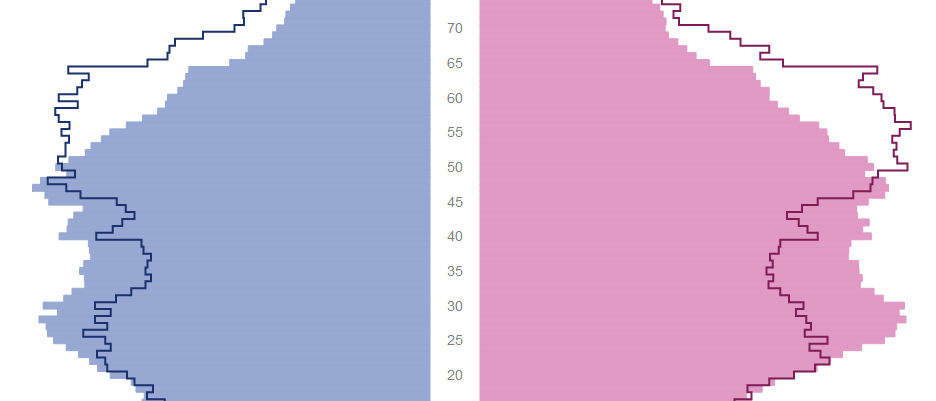
I have developed a population pyramid visualization that shows the age profiles of two places as solid areas and overlay lines for easy comparison. Place names can be typed into text inputs with type-ahead drop downs, and comparison profiles can easily be shared on Twitter and Facebook.
The population pyramid visualization has been developed in collaboration with Jamie Starke and with input from the folks at BC Stats. It shows Canadian Provinces, Census Divisions, and Census Subdivisions using the data from the Canadian 2011 Census.
The visualization is available on Github. You can fork it and for example add data for different countries or change the visual appearance.
D3.js Bar Chart Source Code Generator
2012
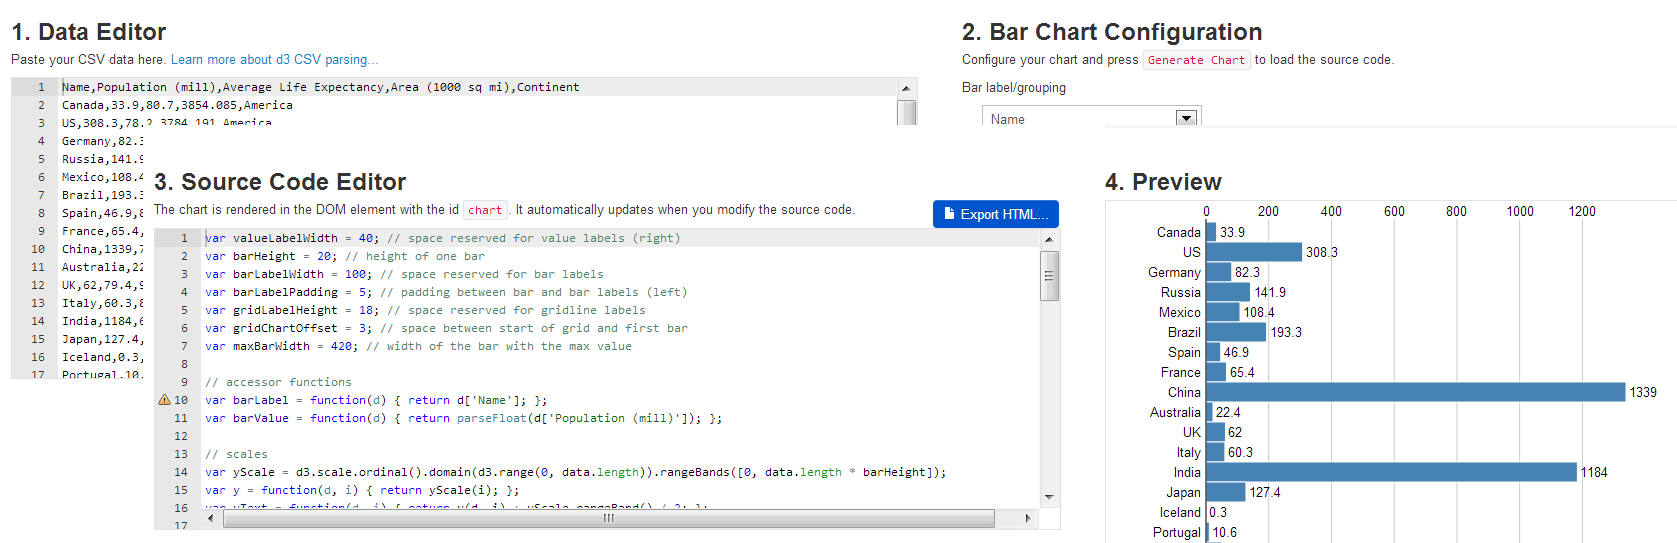
To make getting started with D3.js a bit easier, I wrote a source code generator for bar charts. You can paste you data in CSV format, configure the visual mappings for bar length, grouping, and ordering, generate source code and export the result. The generator gives you a preview of the actual visualization.
BioMixer
2009 - 2012
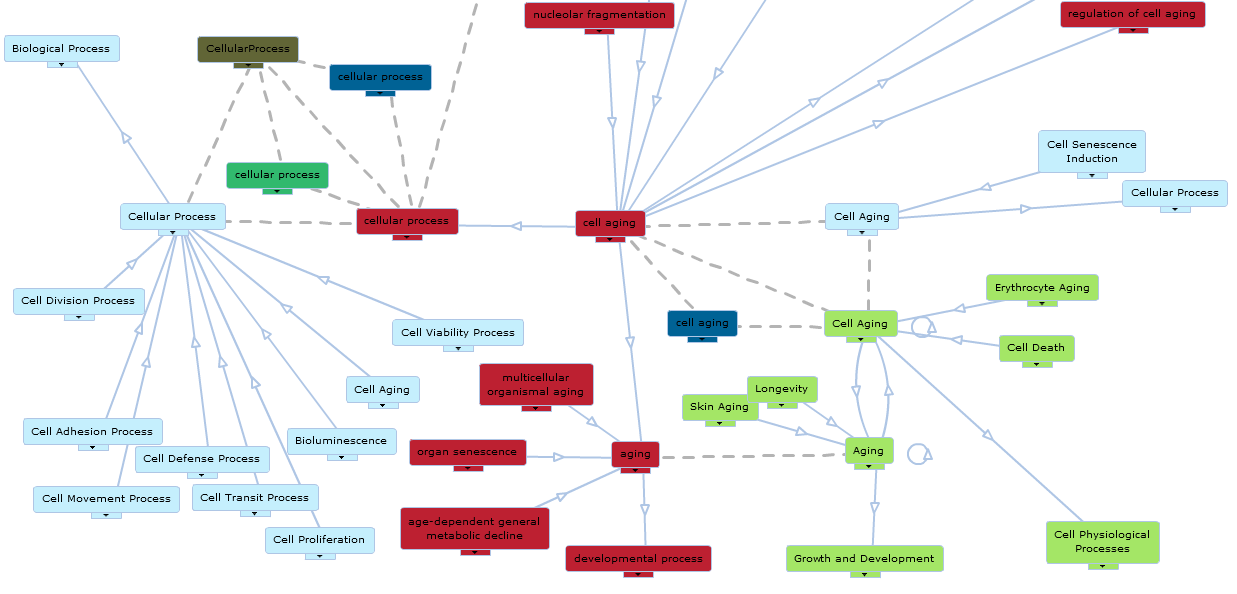
Bio-Mixer is a web-based environment for graph-based visualization of concepts and mappings from multiple biomedical ontologies. Concepts and mappings can be added to multiple visualization using drag-and-drop with drop target highlighting, and the selecting and filtering between the different visualizations is coordinated.
BioMixer visualizations can be shared and embedded into other websites. The NCBO BioPortal uses BioMixer embeds to provide path-to-root, term neighbourhood and mapping neighbourhood visualizations.
I came up with and developed Bio-Mixer as a software developer for the NCBO while being a PhD student at UVic. It is available on Github and actively being developed by the CHISEL group.
Protovis-GWT
2011
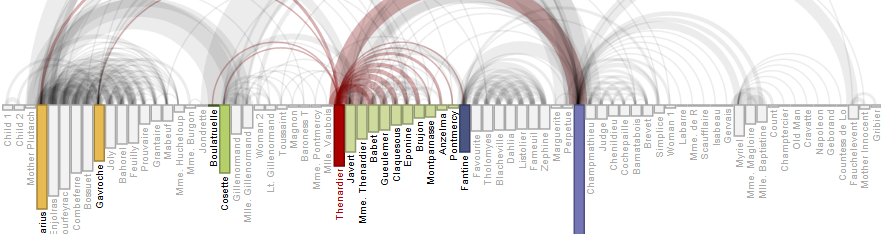
I have written a GWT wrapper for the Protovis visualization library. This wrapper makes it easy to use all the fancy Protovis visualizations in GWT applications. For example, my historical earthquake visualization and the Choosel framework are building on Protovis-GWT.
Earthquake Visualization
2011
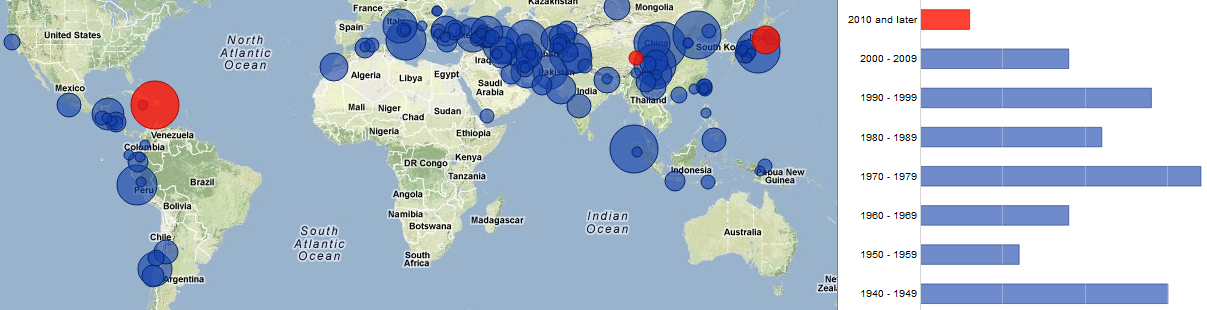
I have created an online visualization of earthquakes with 1k+ deaths since 1900. The data can be explored using coordinated map, timeline and bar chart views. The visualization leverages the Choosel framework components and coordination mechanisms.
Choosel
2010 - 2011

Choosel is a GWT framework for multiple coordinated visualizations. I extracted it from Bio-Mixer to facilitate the reuse of the workbench, the views and the coordination mechanisms.
Choosel was used in several projects besides Bio-Mixer. The WorkItemExplorer uses the Choosel workbench to help developers and managers explore software development task from issue tracking systems. The interactive earthquake infographic uses coordinated map, timeline and bar chart components. A standalone version of the Choosel workbench allows you to upload CSV files and visualize them.
Nomad PIM
2005 - 2009
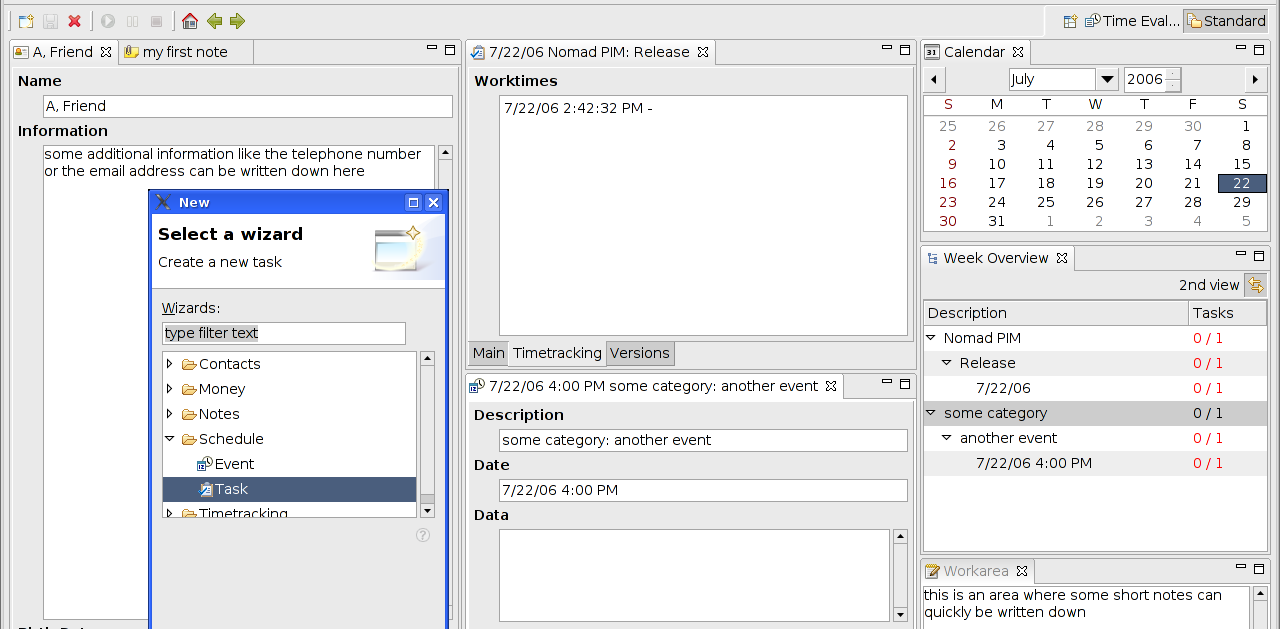
Nomad PIM is a free extensible personal information manager. It provides a platform for integrating personal data, and allows customization to personal needs. Nomad PIM contains modules for personal notes, journal, address book, individual bookkeeping, task management, time tracking and evaluating basic fitness measurements.
Nomad PIM is based on the modular and extensible Eclipse RCP architecture that allows 3rd party plug-ins to extend it. I have envisioned and developed Nomad PIM between 2005 and 2009. It has been downloaded over 50,000 times and was translated into seven languages.
BugzillaMetrics
2006 - 2007
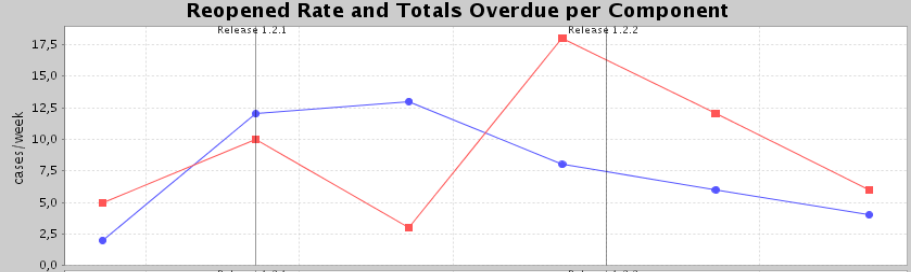
BugzillaMetrics calculates metrics on software development work items stored in a Bugzilla database. It supports custom metric specification, separates between metric specification and data retrieval, uses an event driven algorithm, and transparently optimizes the database queries for the metric calculation. I created initial version of BugzillaMetrics as part of the work for my Master's thesis.
Liga Assistent
2000 - 2004
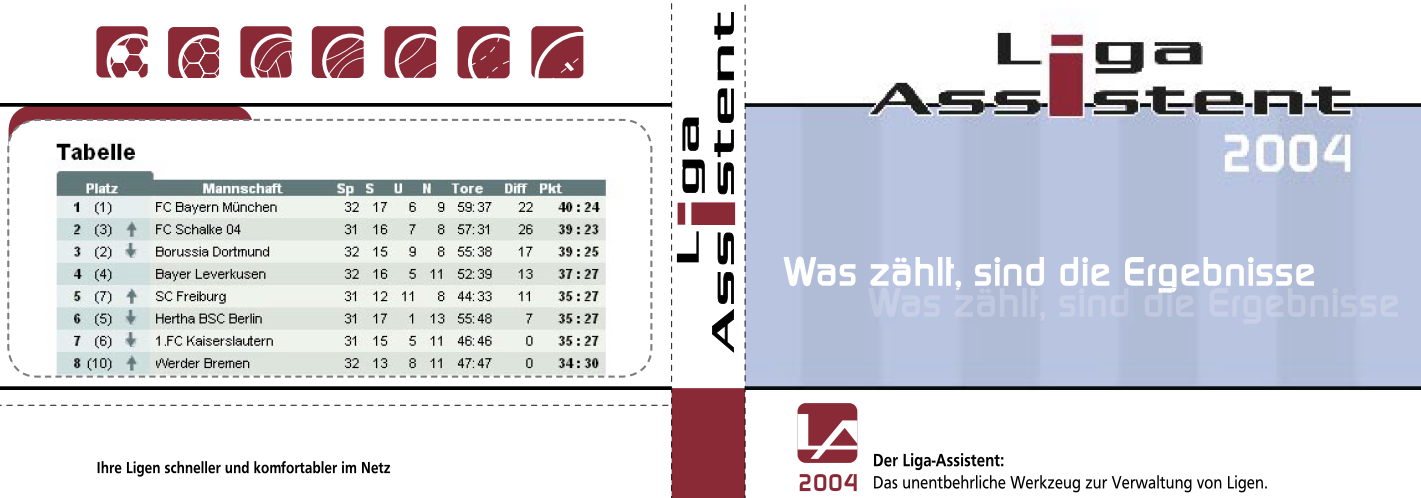
I developed a web application for displaying the standings and schedules of sport leagues. It was designed for regional online newspapers. They could show current standings of regional sports leagues and offer a betting game to their readers.
The web application was based on Java Servlet technology. It included a Java Swing-based rich client for data administration.
Timecontrol
1999 - 2000
I developed a web application for project time tracking and budgeting. It enabled the comparison of the actual project cost vs. the project budget. Timecontrol was developed for use by small design agencies. It supported multiple project members, different task profiles, and had three authorization levels (project member, project manager, admin) with different access rights, especially regarding project overviews and budgets.