Lars Grammel
2012
User Interfaces Supporting Information Visualization Novices in Visualization Construction
Dissertation, University of Victoria, 2012.
Download my PhD thesis.
“The amount of data that is available to us is ever increasing, and thus is the
potential to extract information from it. Information visualization, which leverages
our perceptual system to enable us to perceive patterns, outliers, trends and anomalies
in large amounts of data, is an important technique for exploratory data analysis.
As part of a flexible visual data analysis process, the user needs to construct and
parametrize visualizations, which is challenging for novice users.
In this thesis, I explore how information visualization novices can be supported
in visualization construction. First, I identify existing visualization construction
approaches in a systematic literature survey and examine their use cases. Second, I
conduct a laboratory study to learn about the process and the characteristics of how
information visualization novices construct visualization during data analysis. Third,
I identify natural language visualization queries as a promising alternative specification
approach that I study by analyzing the queries from the laboratory experiment
and by conducting an online survey study. Based on my findings, I propose a
descriptive model of natural language visualization queries. Fourth, I derive guidelines
for visualization construction tools from my studies and from related work. Finally,
I show how these guidelines can be applied to existing visualization tools using the
example of the Choosel visualization framework.”
Crowd Documentation: Exploring the Coverage and the Dynamics of API Discussions on Stack Overflow
Georgia Tech Technical Report GIT-CS-12-05, 2012.
Read the paper.
More about crowd documentation.
BioMixer: Visualizing Mappings of Biomedical Ontologies
Third International Conference on Biomedical Ontologies (ICBO 2012), 2012.
Read the poster paper.
BioMixer: A Web-based Collaborative Ontology Visualization Tool
Proceedings of the 3rd International Conference on Biomedical Ontology (ICBO 2012), 2012.
Try out Bio-Mixer.
Read the conference paper.
WorkItemExplorer: Visualizing Software Development Tasks Using an Interactive Exploration Environment
Proceedings of the 34th International Conference on Software Engineering (ICSE 2012), 2012.
Read the tool paper.
Learn more about the WorkItemExplorer.
Context-aware Recommendation of Visualization Components
Proceedings of the 4th International Conference on Information, Process, and Knowledge Management (eKNOW 2012), 2012.
Read the paper.
2010
How Information Visualization Novices Construct Visualizations
IEEE Transactions on Visualization and Computer Graphics (Proceedings InfoVis 2010), 17(6): 943-952, 2010.
Study the research paper.
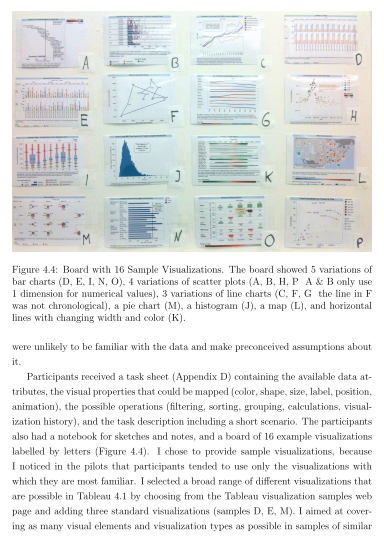
“It remains challenging for information visualization novices to rapidly construct visualizations during
exploratory data analysis. We conducted an exploratory laboratory study in which information visualization novices
explored fictitious sales data by communicating visualization specifications to a human mediator, who rapidly
constructed the visualizations using commercial visualization software. We found that three activities were central
to the iterative visualization construction process: data attribute selection, visual template selection, and
visual mapping specification. The major barriers faced by the participants were translating questions into data
attributes, designing visual mappings, and interpreting the visualizations. Partial specification was common, and
the participants used simple heuristics and preferred visualizations they were already familiar with, such as bar,
line and pie charts. From our observations, we derived abstract models that describe barriers in the data exploration
process and uncovered how information visualization novices think about visualization specifications. Our findings
support the need for tools that suggest potential visualizations and support iterative refinement, that provide
explanations and help with learning, and that are tightly integrated into tool support for the overall visual analytics
process.”
Towards a Foundation for Information Visualization Engineering
VisWeek Workshop: The Role of Theory in Information Visualization (VisWeek 2010), 2010.
Get ideas from the position paper.
Poster: Choosel - Web-based Visualization Construction and Coordination for Information Visualization Novices
Poster, IEEE InfoVis Conference 2010
Read the poster abstract.
Visit Choosel on Google code.
A Survey of Mashup Development Environments
The Smart Internet: Current Research and Future Applications, Springer, 2010.
Read the book chapter.
Smart Media: Bridging Interactions and Services for the Smart Internet
The Smart Internet: Current Research and Future Applications, Springer, 2010.
Read the book chapter.
Attracting the Community's Many Eyes: an Exploration of User Involvement in Issue Tracking
HAoSE 2010: Second Workshop on Human Aspects of Software Engineering, 2010
Read the workshop paper.
Peruse the extended version of the paper.
Mashup Environments in Software Engineering
Web2SE: First Workshop on Web 2.0 for Software Engineering, 2010.
Get ideas from the position paper.
2009
Supporting end users in analyzing multiple data sources
Graduate consortium at IEEE Symposium on Visual Languages and Human-Centric Computing (VL/HCC) 2009.
Read the doctoral consortium paper.
Creating visualizations through ontology mapping
International Workshop on Ontology Alignment and Visualization, 2009.
Read the workshop paper.
2008
An End User Perspective on Mashup Makers
University of Victoria Technical Report DCS-324-IR, 2008.
“This paper presents a review of six mashup makers from an
End User Development (EUD) perspective. The fast-paced development
of mashup makers and related research in the last two years has created
a wealth of features and approaches. To provide an overview of EUD support
in current state-of-the art mashup makers, we explore, summarize
and compare their features across six different themes (Levels of Abstraction,
Learning Support, Community Support, Searchability, UI Design
and Software Engineering Techniques). We found that the mashup makers
provide many features to support end users, but there is still much
room for further improvement. These results can be used to guide both
research and tool design. User studies that reveal the difficulties in using
mashup makers and comparisons of different notations are likely to be
especially fruitful research opportunities.”
2007
BugzillaMetrics - An Adaptable Tool Approach for Evaluating Metric Specifications on Change Requests
International Workshop on Principles of Software Evolution (IWPSE), 2007.
Read the workshop paper.
BugzillaMetrics - Design of an Adaptable Tool for Evaluating User-Defined Metric Specifications on Change Requests
DASMA Metrik Kongress (MetriKon), 2007.
Read the paper.
Development of a Tool for the Evaluation of Change Requests
Masters Thesis (Diplomarbeit), RWTH Aachen University Germany, 2007.
Read the thesis.
Visit the BugzillaMetrics project page.
BugzillaMetrics is a tool for the evaluation of metrics on the issue tracking system Bugzilla. It supports the
flexible definition of metrics on nearly any attribute and event stored in your Bugzilla database.